単純移動平均を例にアイテムインジケーターを作る
概要
アイテムインジケーターの作成方法を、移動平均を例に説明します。
アイテムインジケーターを返す関数をdefault exportで定義してください。
- アイテムインジケーターとは、単独では表示できず、コンテナインジケーターに組み込んで表示するインジケーターです。
操作
トレーディングツール「新規登録>アイテムインジケーター」からアイテムインジケーター作成画面を開いてください。

最小限のアイテムインジケーター
ここでは25期間単純移動平均を作成します。
export default (): ItemIndicator => {
    return {
        type: 'i', //1
        name: "tutor.SMA1", //2
        onInit() { //3
            const smaBuffer = this.addLineBuffer({ //4
                lineColor: 'green',
                lineWidth: 2,
                lineDash: [3, 3] //5
            })
            this.onChartChange = ({ index, closes }) => { //6
                const smaPeriod = 25;
                let sum = 0;
                for (let i = index - smaPeriod + 1; i <= index; i++) {
                    sum += closes.get(i);
                }
                const sma = sum / smaPeriod;
                smaBuffer.set(index, sma); //7
            }
        }
    }
}
| 1 | アイテムインジケーターはtypeプロパティが"i"となります。 | ||||||
| 2 | nameプロパティはインジケータの名前を表します。 名前空間を区切る場合はドット(.)で区切ってください。 | ||||||
| 3 | onInitイベントはインジケーターをチャートに追加したタイミングでFX過去チャート検証くんから呼ばれます。 この中で、インジケーターバッファーの追加などの初期化処理やonChartChangeイベントの処理を実装します。 | ||||||
| 4 | addLineBufferメソッドは線を表示するインジケーターバッファーを戻します。 インジケーターバッファーの追加はonInitイベント実行時のみ可能です。onChartChangeイベント実行時などではインジケーターバッファーの追加をすることはできません。 | ||||||
| 5 | addLineBufferの引数に渡しているlineDashは線の直前・破線のパターンを設定します。
| ||||||
| 6 | onChartChangeイベントはバーや価格に変更があった時にFX過去チャート検証くんから呼ばれます。ここでインジケーターを値を計算します。 | ||||||
| 7 | 終値から移動平均を計算し、lineBufferに格納しています。 IndicarotBufferクラスに定義されているsmaメソッドを使うこともできます。 |
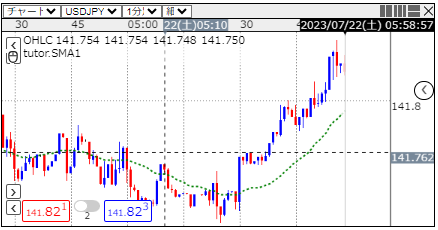
登録したSMAをのチャートに挿入し、25日単純移動平均が表示されることを確認してください。 表示されない場合、コードや手順を再度確認してください。

表示された場合でも幾つか問題点があります。以降でこれらの問題点を修正していきます。
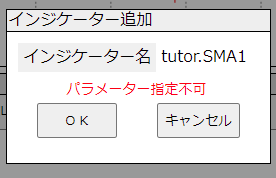
- チャート追加時にSMA期間や色の変更ができない

- データ表示エリアにSMAの値が表示されない

パラメータ化
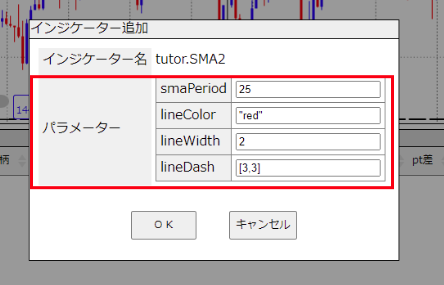
paramsプロパティを設定すると、チャート追加時に設定したい値(SMA期間や線の色等)を設定することができます。 コードを下記のように修正してください。
export default (): ItemIndicator<
    { //1
        period: number
        lineColor: string
        lineWidth: number
        lineDash: number[]
    }
> => {
    return {
        type: 'i',
        name: "tutor.SMA2",
        onInit() {
            const { period, ...smaParams } = this.params //2
            const smaBuffer = this.addLineBuffer(smaParams)
            this.onChartChange = ({ index, closes }) => {
                closes.sma(smaBuffer, period, index)
            }
        },
        params: { //3
            period: 25,
            lineColor: 'red',
            lineWidth: 2,
            lineDash: [3, 3]
        }
    }
}
| 1 | ItemIndicator型の第1型引数にパラメーターの型を定義してください |
| 2 | パラメーターを参照しています。インジケーター追加時に手動で変更した場合はその値が格納されています。 |
| 3 | パラメーターの規定値を設定してください。このパラメーターはインジケーターチャート追加時に変更することができます。  paramsプロパティにIndicatorUtil.getParameterを使って他のインジケーターのパラメーターを指定する場合、直接指定せず、関数にする必要があります。 |
リプレイ時価格の表示
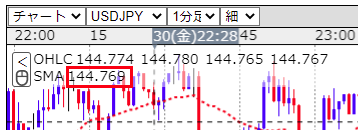
getDisplayDataメソッドを実装すると、 データ表示エリアに作成したインジケーターの値を表示することができます。コードを次のように修正してください。
export default (): ItemIndicator<
    {
        period: number
        lineColor: string
        lineWidth: number
        lineDash: number[]
    }
> => {
    return {
        type: 'i',
        name: "tutor.SMA3",
        onInit() {
            const { period, ...smaParams } = this.params
            const smaBuffer = this.addLineBuffer(smaParams)
            this.shortName = 'SMA' //1
            this.onChartChange = ({ index, closes }) => {
                closes.sma(smaBuffer, period, index)
            }
            this.getDisplayData = (index) => {//2
                return {
                    sma: smaBuffer.get(index)
                }
            }
        },
        params: {
            period: 25,
            lineColor: 'red',
            lineWidth: 2,
            lineDash: [3, 3]
        }
    }
}
| 1 | データ表示エリアに表示されるインジケーター名はnameプロパティが設定されます。 これをを変更する場合はshortNameプロパティを設定します。 |
| 2 | インジケーターの価格を価格表示エリアに表示するには、getDisplayDataを実装してください。 マウスカーソルがチャート上にある時はマウスカーソルが指している日時を、ない時は直近の日時のデータを表示します。 V1.9.1.0時点でkeyは表示されません。 |
他のインジケーターから呼び出した時に型情報を公開する
callItemIndicator,addContaienrIndicatorを使って他のインジケーターを呼び出すことができます。 呼び出されるインジケーターの型情報を呼び出すインジケーター・ストラテジーでも参照可能にするには、ItemIndicatorの第2型引数に公開するプロパティを定義してください
詳細はGMMAを作る/callItemIndicatorの使用例参照してください。
export default (): ItemIndicator<
    {
        period: number
        lineColor: string
        lineWidth: number
        lineDash: number[]
    }, {
        smaBuffer: IndicatorBuffer //1
    }
> => {
    return {
        type: 'i',
        name: "tutor.SMA4",
        onInit() {
            const { period, ...smaParams } = this.params
            const smaBuffer = this.smaBuffer = this.addLineBuffer(smaParams) //2
            this.shortName = 'SMA'
            this.onChartChange = ({ index, closes }) => {
                closes.sma(smaBuffer, period, index)
            }
            this.getDisplayData = (index) => {
                return {
                    sma: smaBuffer.get(index)
                }
            }
        },
        params: {
            period: 25,
            lineColor: 'red',
            lineWidth: 2,
            lineDash: [3, 3]
        }
    }
}
| 1 | ItemIndicatorの第2型引数に、callItemIndicatorで呼び出された場合も公開する型情報を定義しています。 |
| 2 | thisに公開する値の参照を設定しています |
終値以外の移動平均線の表示
パラメーターで始値、高値、安値、終値を設定し、onChartChangeでどの価格を使うかを選択すれば終値以外の移動平均線を表示できるようになります。
export default (): ItemIndicator<
    {
        period: number
        lineColor: string
        lineWidth: number
        lineDash: number[]
        targetOhlc: 'opens' | 'highs' | 'lows' | 'closes' //1
    }, {
        smaBuffer: IndicatorBuffer
    }

> => {
    return {
        type: 'i',
        name: "tutor.SMA",
        onInit() {
            const { period, targetOhlc, ...smaParams } = this.params
            const smaBuffer = this.smaBuffer = this.addLineBuffer(smaParams)
            this.shortName = 'SMA'
            this.onChartChange = ({ index, ...rest }) => {
                const targetBuffer = rest[targetOhlc] //2
                if (!targetBuffer) {
                    throw new Error(`${targetOhlc}にはopens,highs,lows,closesを指定してください`) //3
                }
                targetBuffer.sma(smaBuffer, period, index)
            }
            this.getDisplayData = (index) => {
                return {
                    sma: smaBuffer.get(index)
                }
            }
        },
        params: {
            period: 25,
            lineColor: 'red',
            lineWidth: 2,
            lineDash: [3, 3],
            targetOhlc: 'closes'
        }
    }
}
| 1 | パラメーターで始値、高値、安値、終値を設定できるようにしています。 |
| 2 | onChartChangeの引数オブジェクトから、パラメータで指定した始値、高値、安値、終値のインジケータバッファーを取得しています。 |
| 3 | インジケーターチャート表示時のパラメータ入力ではTypeSciptの型チェックは未対応の為、不正な値が指定された場合はエラーとしています。 |
移動平均乖離率の追加
移動平均乖離率を表示したコンテナインジケーターを追加します。
